Choosing the appropriate indicators to make technical debt visible and actionable in a dashboard is the first step in adopting a consistent approach to tracking and addressing it across teams. The lack of visibility contributes to mounting technical debt that slows down software delivery and negatively impacts quality.
Most efforts to remediate technical debt are often chaotic and reactionary. Consequently, software engineering leaders are unable to measure the risks and impact of technical debt on value delivery. As a result, they struggle to handle technical debt or respond to important questions like:
- How much debt is there in the code?
- Which debt should be prioritized for fixing?
- How much progress are teams making in remediating technical debt?
- How much business risk is buried in the technical debt load?
Fixr Overview Dashboard
The Fixr Overview Dashboard makes measurements broadly visible and accessible for software engineering leaders and other stakeholders, supporting the following actions:
- Establishing a consistent approach for measuring technical debt across teams by identifying and aggregating the highest-impact risk items.
- Focusing on metrics that, when aggregated, provide insight into the impact of technical debt on value delivery, team behavior, and code quality.
- Communicating progress in managing technical debt to both team and business leaders.
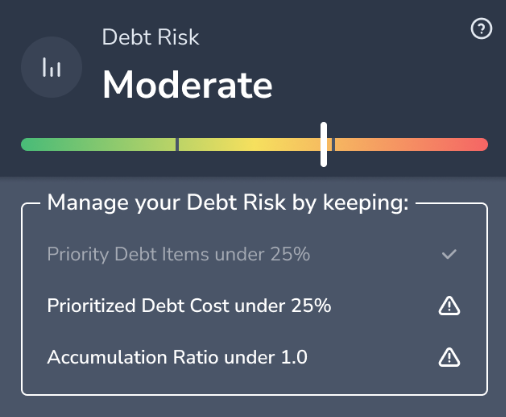
Debt Risk
Technical debt represents a risk to achieving high-quality software delivery. This metric ranges from low to high and represents an aggregation of three core measures: priority debt items, prioritized debt cost, and accumulation ratio. The further these measures are from the threshold, the greater the overall risk.
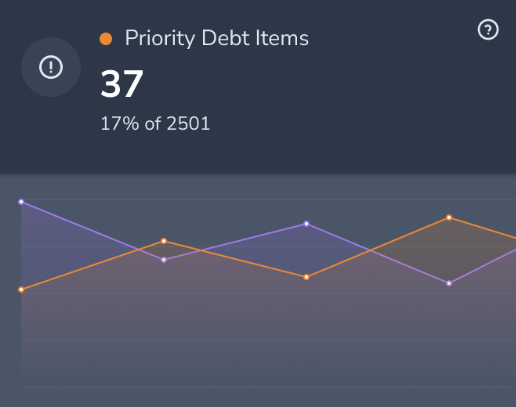
Priority debt items
This is the output of the technical debt prioritization process, or, in other words, the items that should be remediated first. Fixr follows the PAID (Plan, Address, Ignore, Delay) methodology to prioritize items. Items that could cause a high impact (high severity) and are the most likely to realize this business impact (high probability) are the ones that should be remediated immediately (address). The table below illustrates the prioritization methodology:
This metric is the output of the technical debt prioritization process, identifying which items should be addressed first. Fixr follows the PAID (Plan, Address, Ignore, Delay) methodology to prioritize items. Items with high severity and a high probability of business impact should be addressed immediately. The table below illustrates the prioritization methodology:
| Name | Severity | Probability |
|---|---|---|
| (P)lan | High | Low |
| (A)ddress | High | High |
| (I)gnore | Low | Low |
| (D)elay | Low | High |
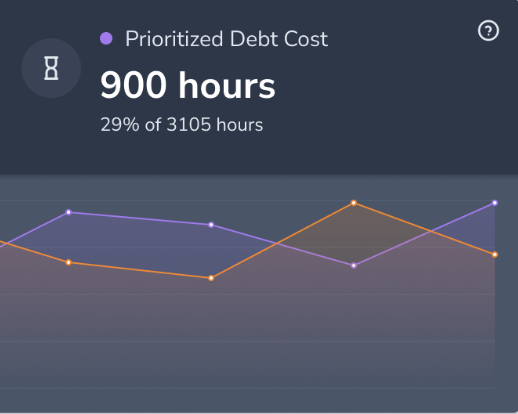
Prioritized debt cost
This metric represents the total cost of prioritized technical debt items. It helps normalize expectations about the overall cost of resolving the most critical items and demonstrates how the technical debt backlog impacts the product budget.
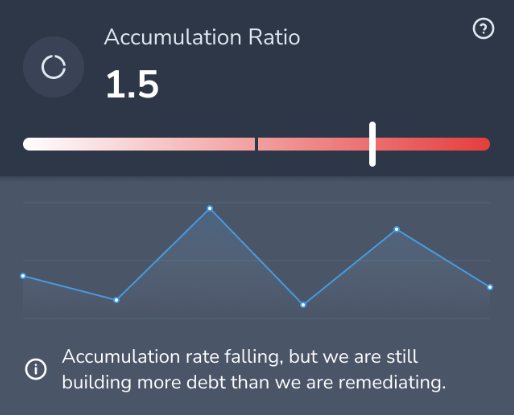
Accumulation ratio
This ratio shows new technical debt identified versus items remediated. A ratio greater than one indicates more debt issues were found than remediated during the reporting period (the two most recent scans). A ratio less than one indicates more technical debt items were resolved than identified. Tracking a declining ratio over time suggests overall technical debt management is reducing risk in the instance. To maximize this metric, schedule regular instance scans (e.g., every Friday, or once a month) using the scan scheduling feature.
Continuously track and communicate data insights
Software engineering executives must establish a schedule for reviewing the technical debt dashboard. During this review, they should examine progress on current top-risk items and observe trends since the previous report (e.g., upward or downward trends). Additionally, keeping business stakeholders informed on the progress of technical debt management is essential for negotiating approval and securing funding for remediation efforts.